
POPULATION PROJECTION Pyramids
Project: Population Projection Pyramids
On selecting the pyramid chart to display population projections with, users are presented with two identical populations, that both default to displaying the full UK population, along with a number of interactive selection lists, and other controls (sliders and toggle buttons) which allow the user to further interrogate the population data with.
Users should use these to define specific sub-population characteristics from the full UK population, and then interrogate and modify the chart display to suit their needs.
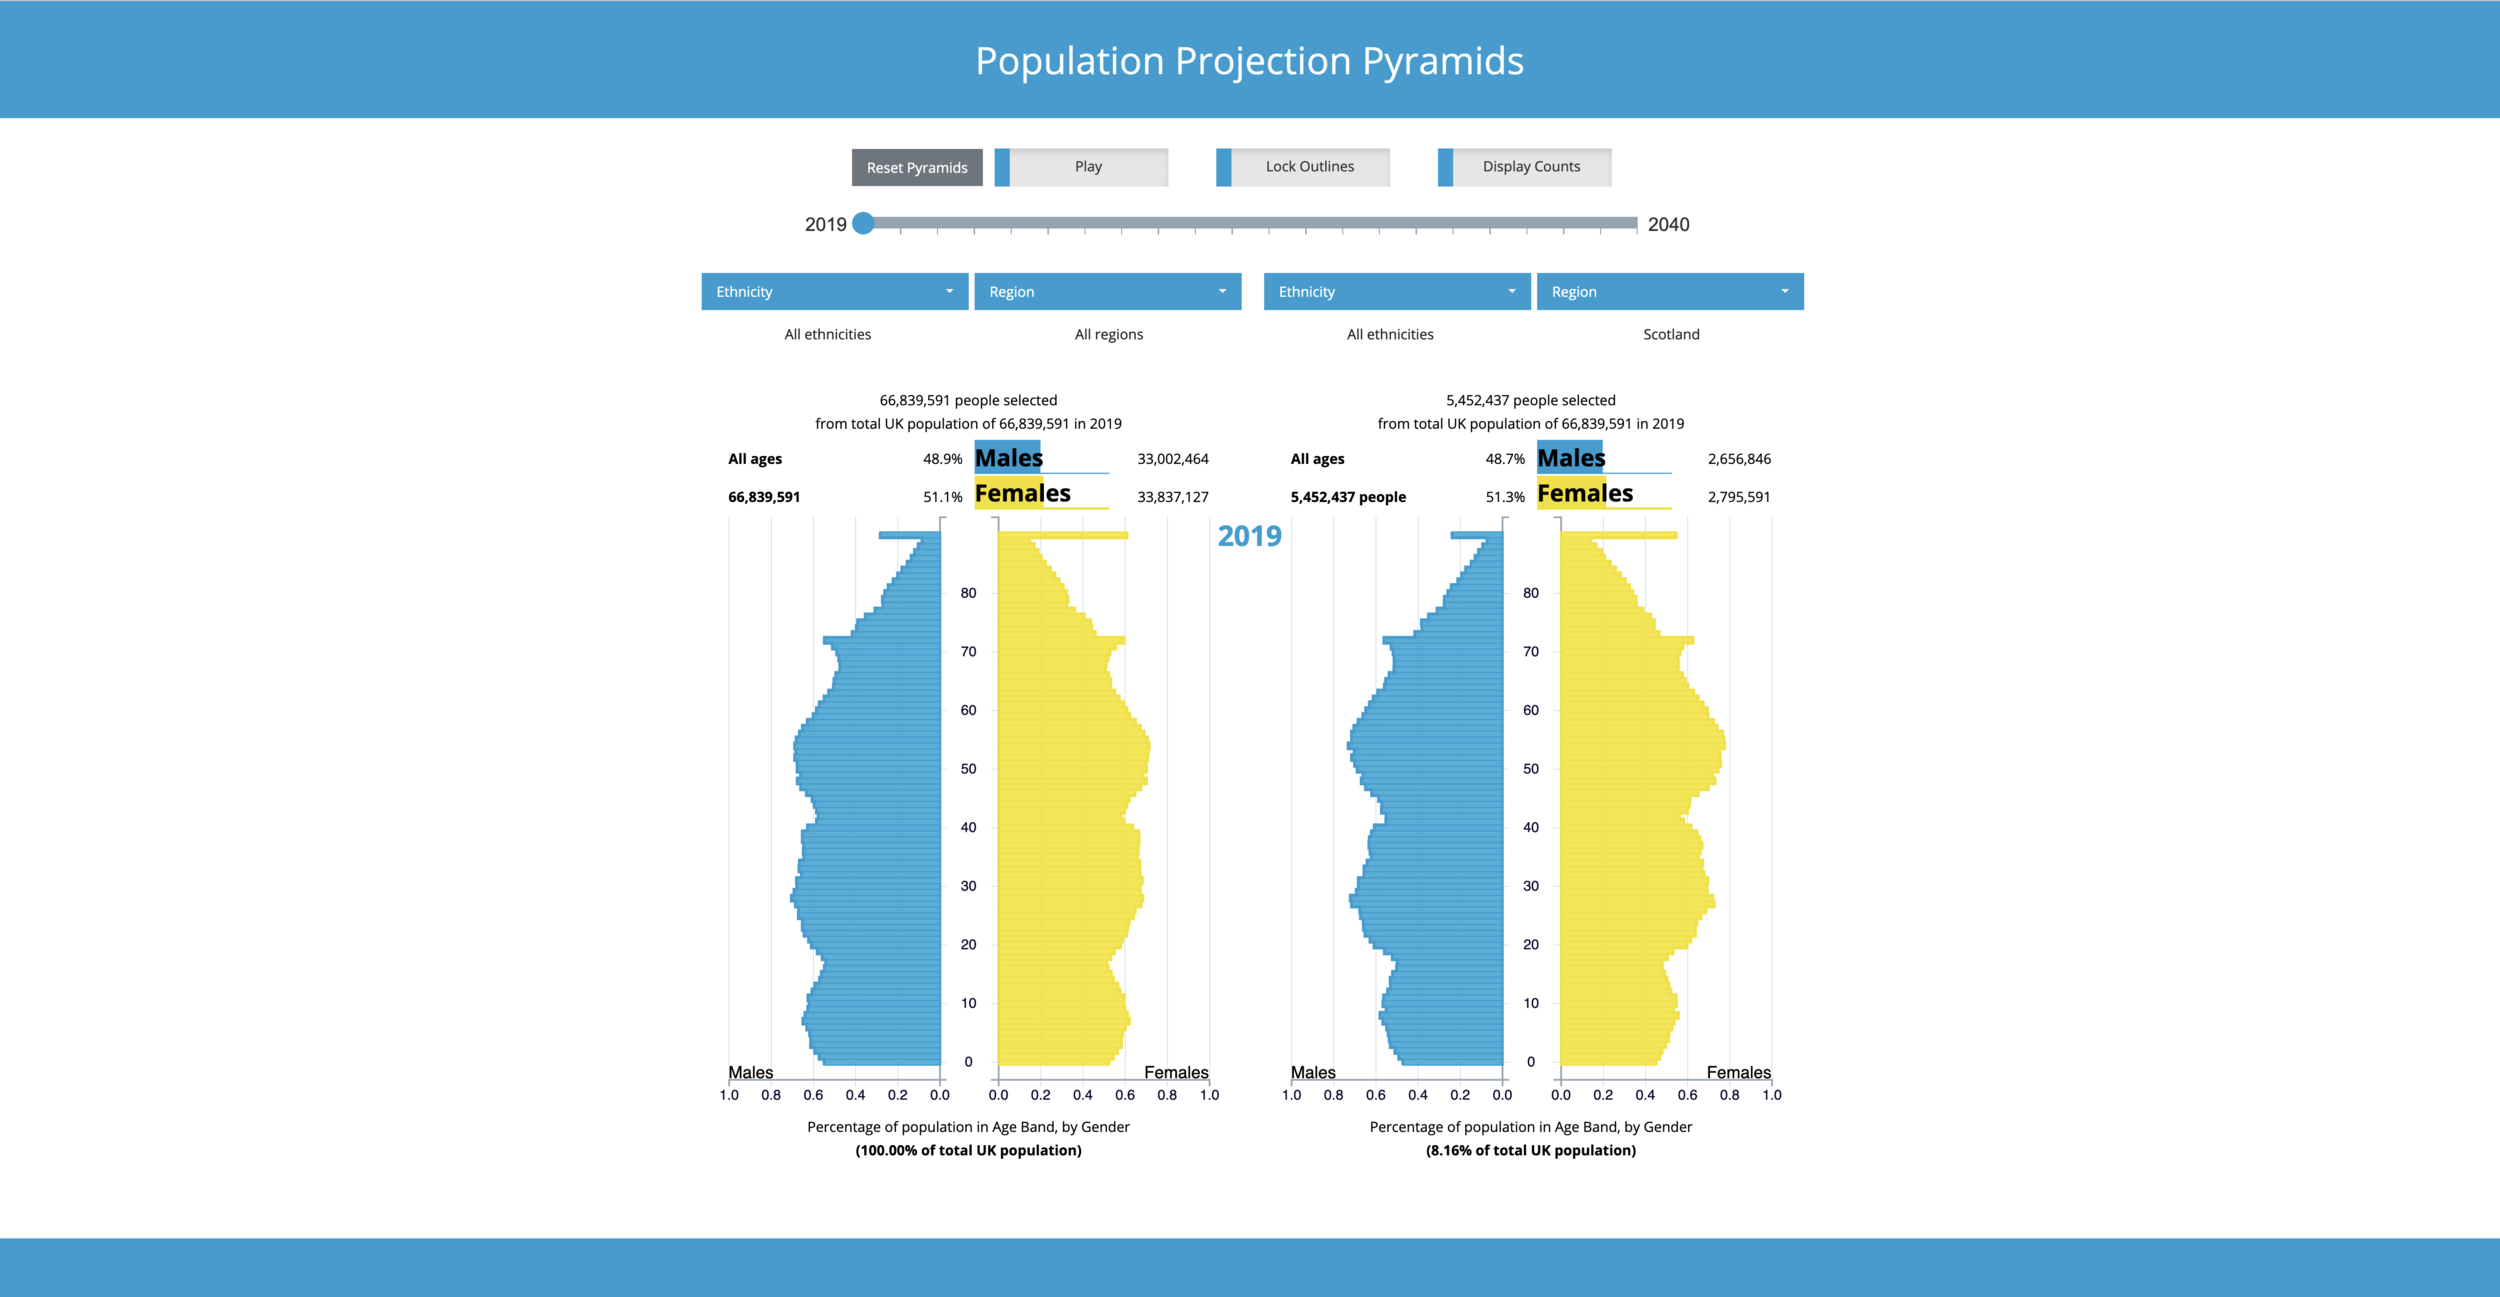
Initial chart view after selecting population pyramids to view population projection data with.
Chart view modified after users ‘locks’ pyramid outlines to 2019 and moves data year slider’s handle at top of charts to new display data year of 2040. Pyramid outlines remain fixed in place at 2019 values, while underlying data blocks unapt to 2040 values.
User selects a single year of age data row on either population pyramid to view statistics for that chosen age value.
User selects an age range on either population pyramid to view statistics for that chosen age range interval.
User selects to display population pyramids against absolute counts of population instead of percentage of total UK population.
User selects a sub-group of the full UK population on one of the two population pyramids. Here, they have selected to display on the population of Scotland on the right-hand chart.